Data Engineer & BI Analyst

YourFashion SALES REPORT
YourFashion is a global jewelry brand selling products to different markets. I as a marketing data analyst need to prepare a product analysis report to the marketing management team (top-performing, bottom-performing products and sales trend) and also help the local marketing team to understand their own market performance (currency conversion) by using Power BI.
Click Here to see the dashboard in Power BI service.
SOLUTIONS:
Case Analysis (5W2H)
-
Who needs to see the dashboard?
-
what are they want to see (key matrics)?
-
where they want to see (web or mobile)?
-
why they want to see the dashboard?
-
when they want to see the dashboard?
-
how they want to see (by products, by time or by currency)?
-
how much will spend on this project (time and money)?
Load and Transform Data
Load the raw data from different original sources and Transform the data to data can be easily used in Power BI.
Best Practice:
-
Create a parameter FolderPath for other people to load data easily on other devices.
Star Schema Modeling
In this project, in order to perform time intelligence calculation, I created a DimDate table connected to the FactSalesOverview table, because to perform time intelligence calculation, the date column in date dimension table should have unique value and no gaps.
Best Practice:
-
Use Layouts to make your models easy to create and understand at a glance.
-
In the relationship between fact table and dimension table ("One to Many"), "One" is always on dimension table side.

Create BUS Matrix
In the following BUS Matrix, the "X" represents which dimensions and facts should be connected and how they should be connected in the model.

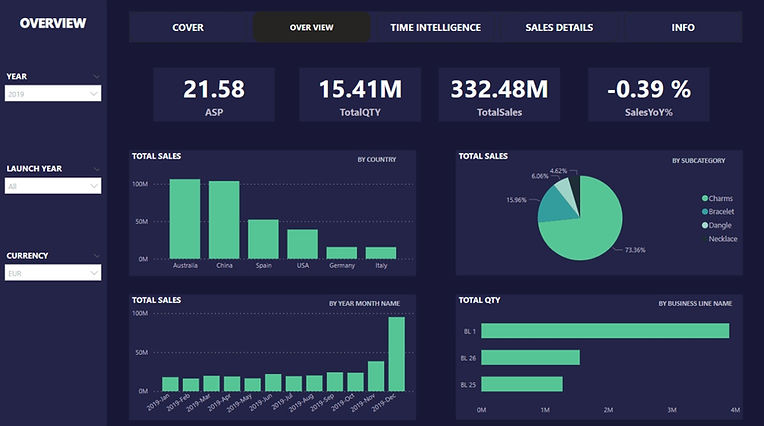
Create a nice dashboard to present the insights and results.
In this project, it includes :
-
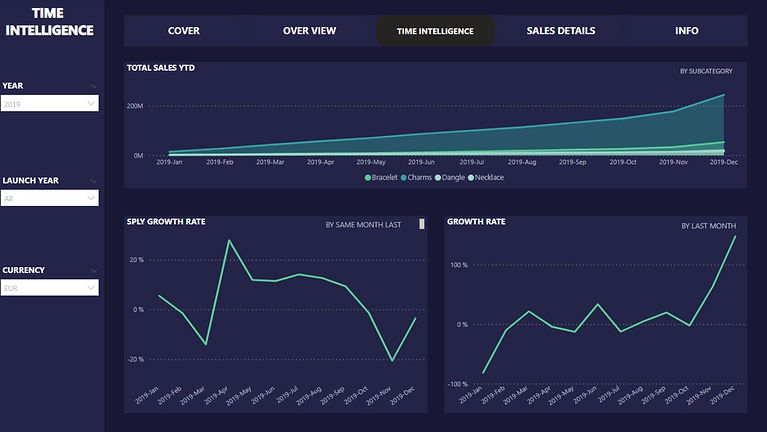
Time intelligence: Calculate YTD (Year To Date) Sales, MTD (Month to Date) Sales, SPLY (Same Period Last Year) Sales, YoY% (Year Over Year Growth rate).
-
Calculate TotalSalesAmount based on the selected currency and year.
-
Calculate Discount % based on actual sales amount and List price. Expected Sales Amount by List Price should also work with different currency.
-
Calculate ASP (Average Sales Price)
Best Practice:
-
Use Tooltip to present more information clearly.


Analyse the dashboard and provide insights in a story-telling way
-
Analyse top-selling / top-bottom products
-
Analyse top-selling discount groups
-
Analyse top-contributing customers
-
Analyse sales development
-
Analyse sales and growth rate by time series
-
Analyse sales quantity
-
Analyse sales by locations